Monitoring vs. Observability: Understanding the Key Differences and Best Practices 2024

As software and machine learning systems grow in complexity, ensuring system reliability, performance, and debugging capabilities becomes more challenging. Traditionally, monitoring was the standard approach to tracking system health, but as modern architectures evolve, observability has emerged as a more comprehensive framework.
This blog explores: ✅ The differences between monitoring and observability
✅ Why both are essential for modern software and ML systems
✅ Best practices for implementing effective monitoring and observability pipelines
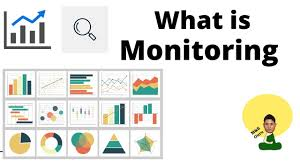
What is Monitoring?

Monitoring is the practice of collecting, analyzing, and visualizing system metrics to ensure operational health. It typically involves:
- Tracking predefined system behaviors
- Generating alerts when issues arise
- Providing visibility into known failure modes
Types of Monitoring
- Blackbox Monitoring
- Observes a system from the outside to check for failures.
- Example: Checking if a website is up or down via ping tests.
- Whitebox Monitoring
- Examines system internals such as logs, metrics, and traces.
- Example: Tracking CPU usage, database queries, and memory consumption.
✅ Best Practices for Monitoring:
- Monitor key system metrics such as latency, error rates, and disk usage.
- Use alerting systems to notify teams of critical issues.
- Automate response mechanisms to handle predictable failures.
📌 Example:
A web application monitoring setup may track response times, user requests, and error logs to detect performance degradation.
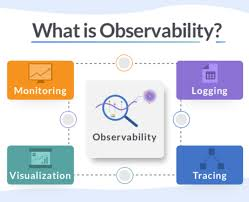
What is Observability?

Observability extends beyond monitoring by providing a holistic view of system behavior, enabling engineers to understand WHY an issue occurred, not just that it occurred.
Key Differences from Monitoring
| Aspect | Monitoring | Observability |
|---|---|---|
| Goal | Detect failures | Diagnose and debug failures |
| Scope | Predefined failure modes | Unknown and emerging issues |
| Data Sources | Logs, metrics, alerts | Logs, metrics, traces, events |
| Response | Reactive | Proactive |
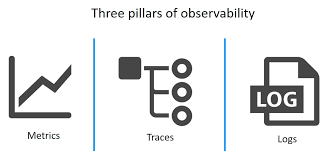
The Three Pillars of Observability

- Metrics 📊
- Numeric values representing system state over time.
- Example: CPU utilization, memory consumption, API request counts.
- Logs 📝
- Text-based records of events in a system.
- Example: Error messages, audit logs, debugging statements.
- Traces 🔍
- Provide end-to-end visibility across distributed services.
- Example: Tracking a user request across multiple microservices.
✅ Best Practices for Observability:
- Instrument all system components to capture logs, metrics, and traces.
- Centralize data collection in platforms like Grafana, Prometheus, or Datadog.
- Correlate monitoring data with business KPIs for actionable insights.
📌 Example:
A distributed e-commerce system can use observability to trace a customer’s order through different services (cart, checkout, payment) and diagnose failures before customers notice them.
Monitoring vs. Observability: Why Both Matter
Monitoring tells you something is wrong, while observability helps you understand why.
Use Cases for Monitoring
✅ Detecting known failure modes (e.g., server outages, database crashes).
✅ Tracking predefined business metrics (e.g., conversion rates).
✅ Setting up automated alerts for predictable incidents.
Use Cases for Observability
🔍 Investigating unanticipated system behavior.
🔍 Debugging intermittent failures across services.
🔍 Detecting hidden performance bottlenecks before they impact users.
Building a Monitoring & Observability Strategy
1️⃣ Define Key Performance Indicators (KPIs)
- Identify critical metrics (e.g., uptime, response latency, error rates).
- Set alert thresholds to notify teams of anomalies.
2️⃣ Implement a Centralized Logging System
- Use structured logs to enhance searchability.
- Store logs in platforms like Elastic Stack (ELK), Datadog, or Splunk.
3️⃣ Set Up Distributed Tracing
- Use OpenTelemetry, Jaeger, or Zipkin to trace user requests across services.
- Visualize traces to detect bottlenecks in API calls or database queries.
4️⃣ Enable Automated Alerting & Incident Response
- Integrate alerts with PagerDuty, Slack, or Microsoft Teams.
- Use AIOps (AI for IT Operations) to detect patterns and auto-resolve common issues.
Monitoring & Observability Tools: What to Use?
Here’s a breakdown of popular tools for metrics, logging, and tracing:
| Tool | Category | Best For |
|---|---|---|
| Prometheus | Metrics Collection | Time-series monitoring |
| Grafana | Visualization | Dashboarding & alerts |
| Elastic Stack (ELK) | Logging | Scalable log analysis |
| Jaeger | Tracing | Distributed systems tracing |
| Datadog | Full-stack Observability | Cloud monitoring |
Future of Observability: Trends to Watch
🚀 AI-Driven Anomaly Detection
- Using machine learning models to predict and prevent failures before they happen.
🌍 Observability for Edge Computing
- Monitoring decentralized IoT and edge devices with real-time insights.
📜 Compliance & Security Observability
- Ensuring GDPR and AI governance compliance through auditable logs.
🔄 Self-Healing Systems
- Automating remediation workflows based on observed anomalies.
Final Thoughts
Monitoring and observability are not competing concepts—they complement each other to provide full-stack visibility into modern applications and ML systems.
By combining proactive monitoring with deep observability insights, teams can:
✅ Detect failures faster 🚨
✅ Debug production issues efficiently 🔍
✅ Ensure AI fairness and transparency ⚖️